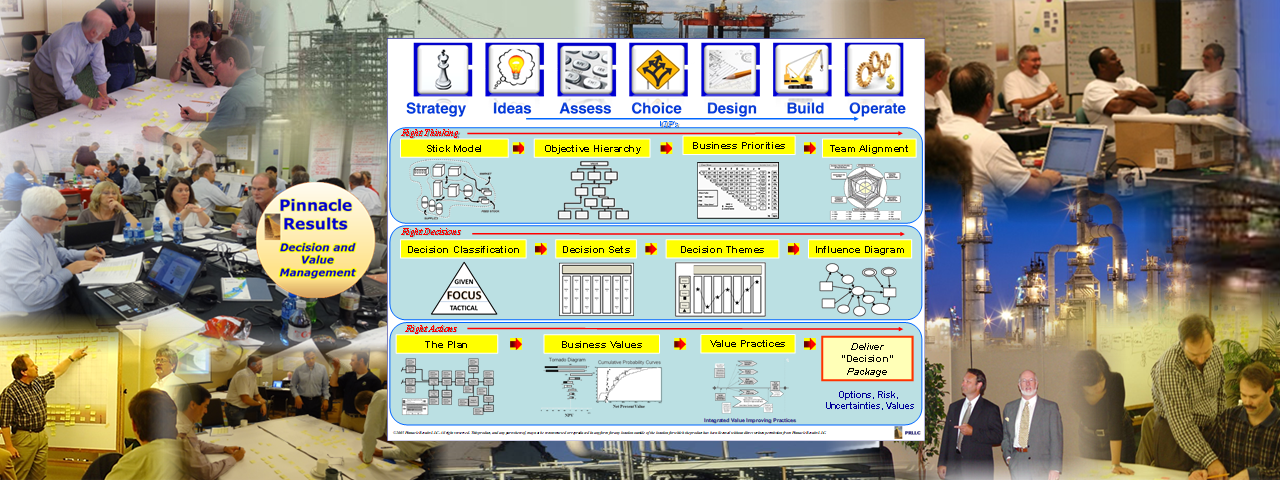
The BlueSheet Methodology for Project Optimization
The BlueSheet methodology serves as an integration framework that spans from initial concept to full asset operation. Its ultimate goal is to optimize project return on investment (ROI) and empower decision-makers to objective funding pathways at critical gate reviews.
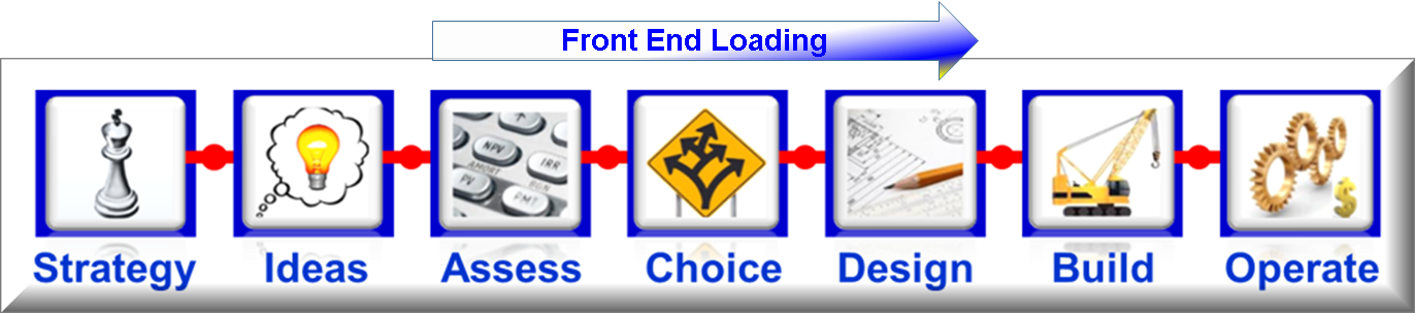
The architecture is divided into three distinct tiers mapping out the classic value chain: Right Thinking (Top Line), Right Decisions (Middle Line), and Right Actions (Bottom Line). Below is the system-engineering breakdown of what each tool means and how they function together within the Front-End Loading (FEL) stages:
- Primary Function: A systems-engineering meta-governance tool deployed at the start of FEL-2 to architect the logical work program and determine the requisite design and analyses for the ultimate Decision Support Package (DSP) - not to execute the physical engineering work.
- Delivery Rhythm: Executed via hybrid on-site sessions or spaced, modular online video workshops intentionally structured to invite reflective pauses and asynchronous stakeholder calibration, eliminating workshop fatigue while maximizing decision quality without disrupting daily operational workflows.
-
Upstream Positioning: Structurally aligns the top and middle lines of the value chain ("Right Thinking" and "Right Decisions") to establish clear decision criteria, project boundaries, and Value Improving Practices (VIPs) before execution engines or contractors are deployed.
"Right Thinking" (Project Boundary & Scope Alignment)
The top line contains the strategic tools required to define the exact boundaries, constraints, and priorities of the investment. It establishes a shared mental model, preventing cross-functional teams from designing or constructing the wrong asset by stripping away unvetted assumptions before capital is committed.
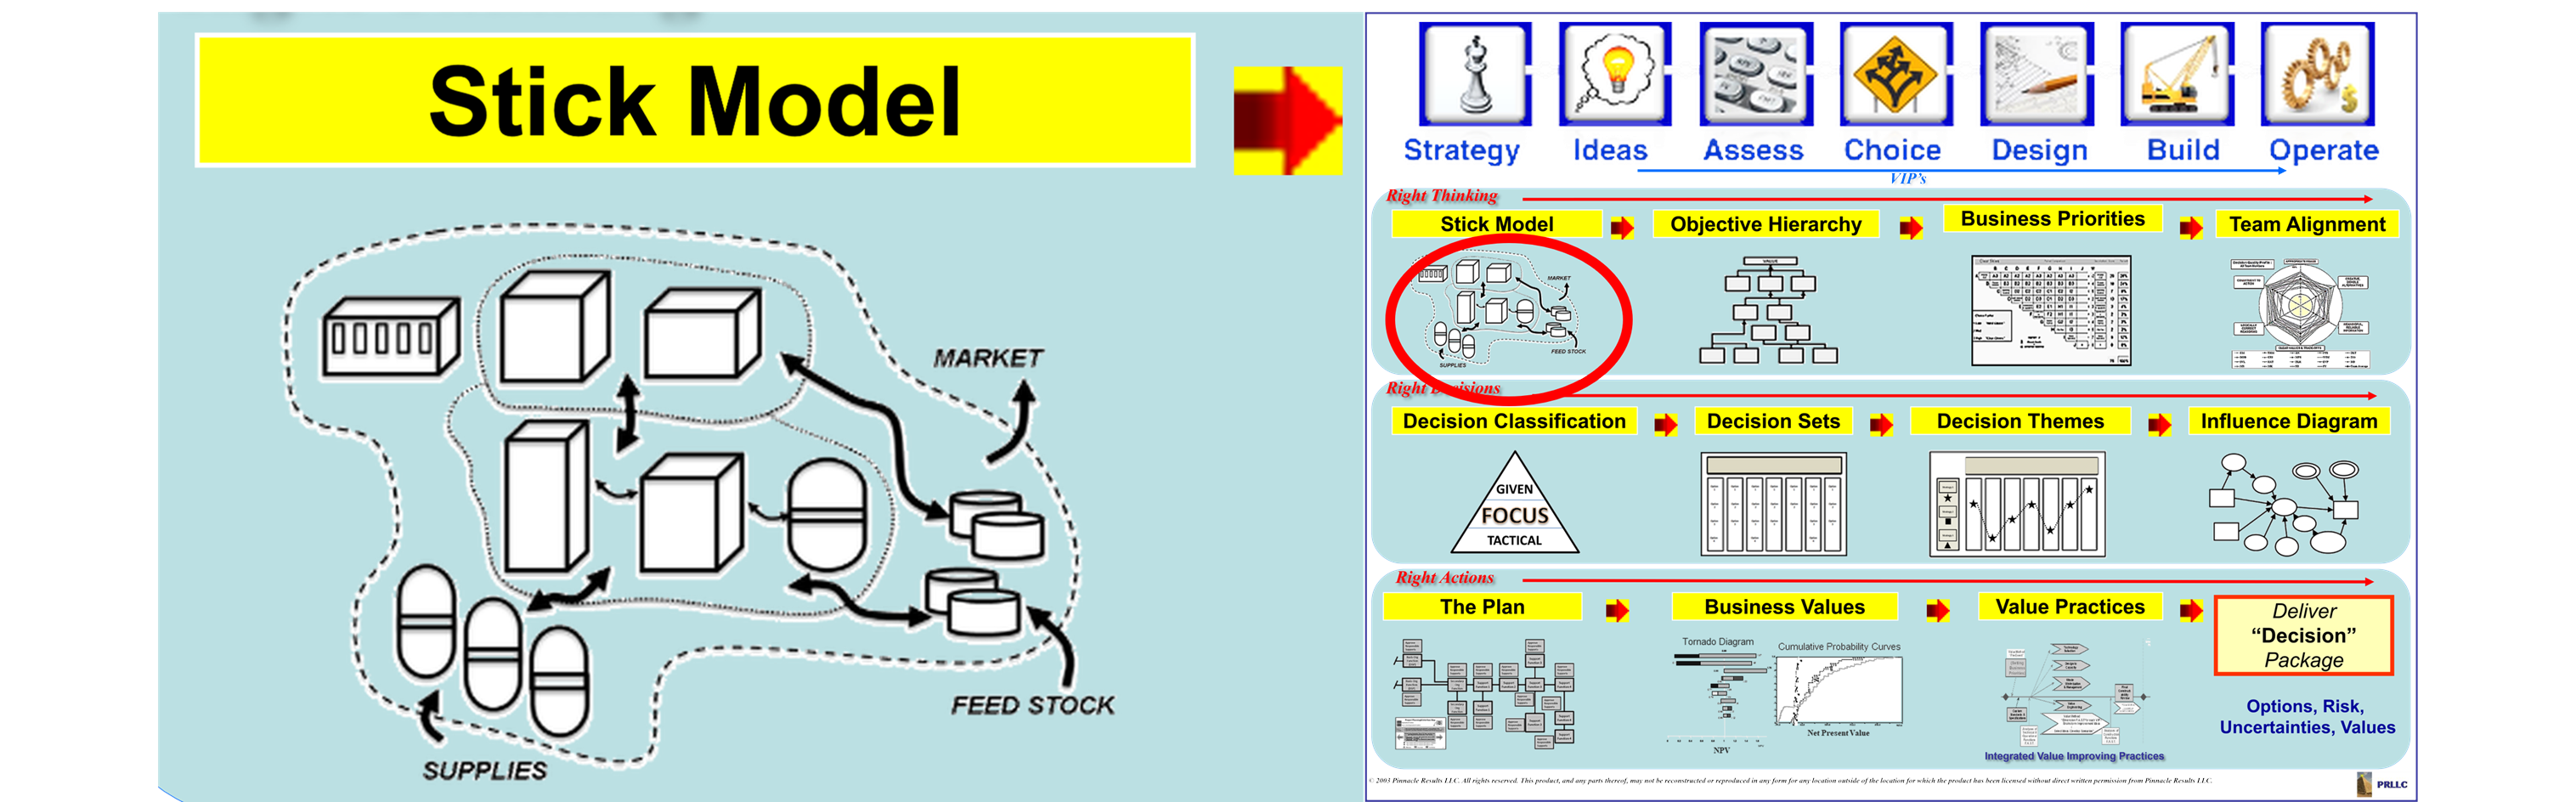
Stick Model (Scope Model):
The physical, commercial, and operational boundary definition tool. It maps out exactly where your project scope connects to external systems, utility infrastructures, or legacy assets. It formally defines the Scope limits of the work, preventing different internal departments or external contractors from assuming someone else is covering a critical interface.
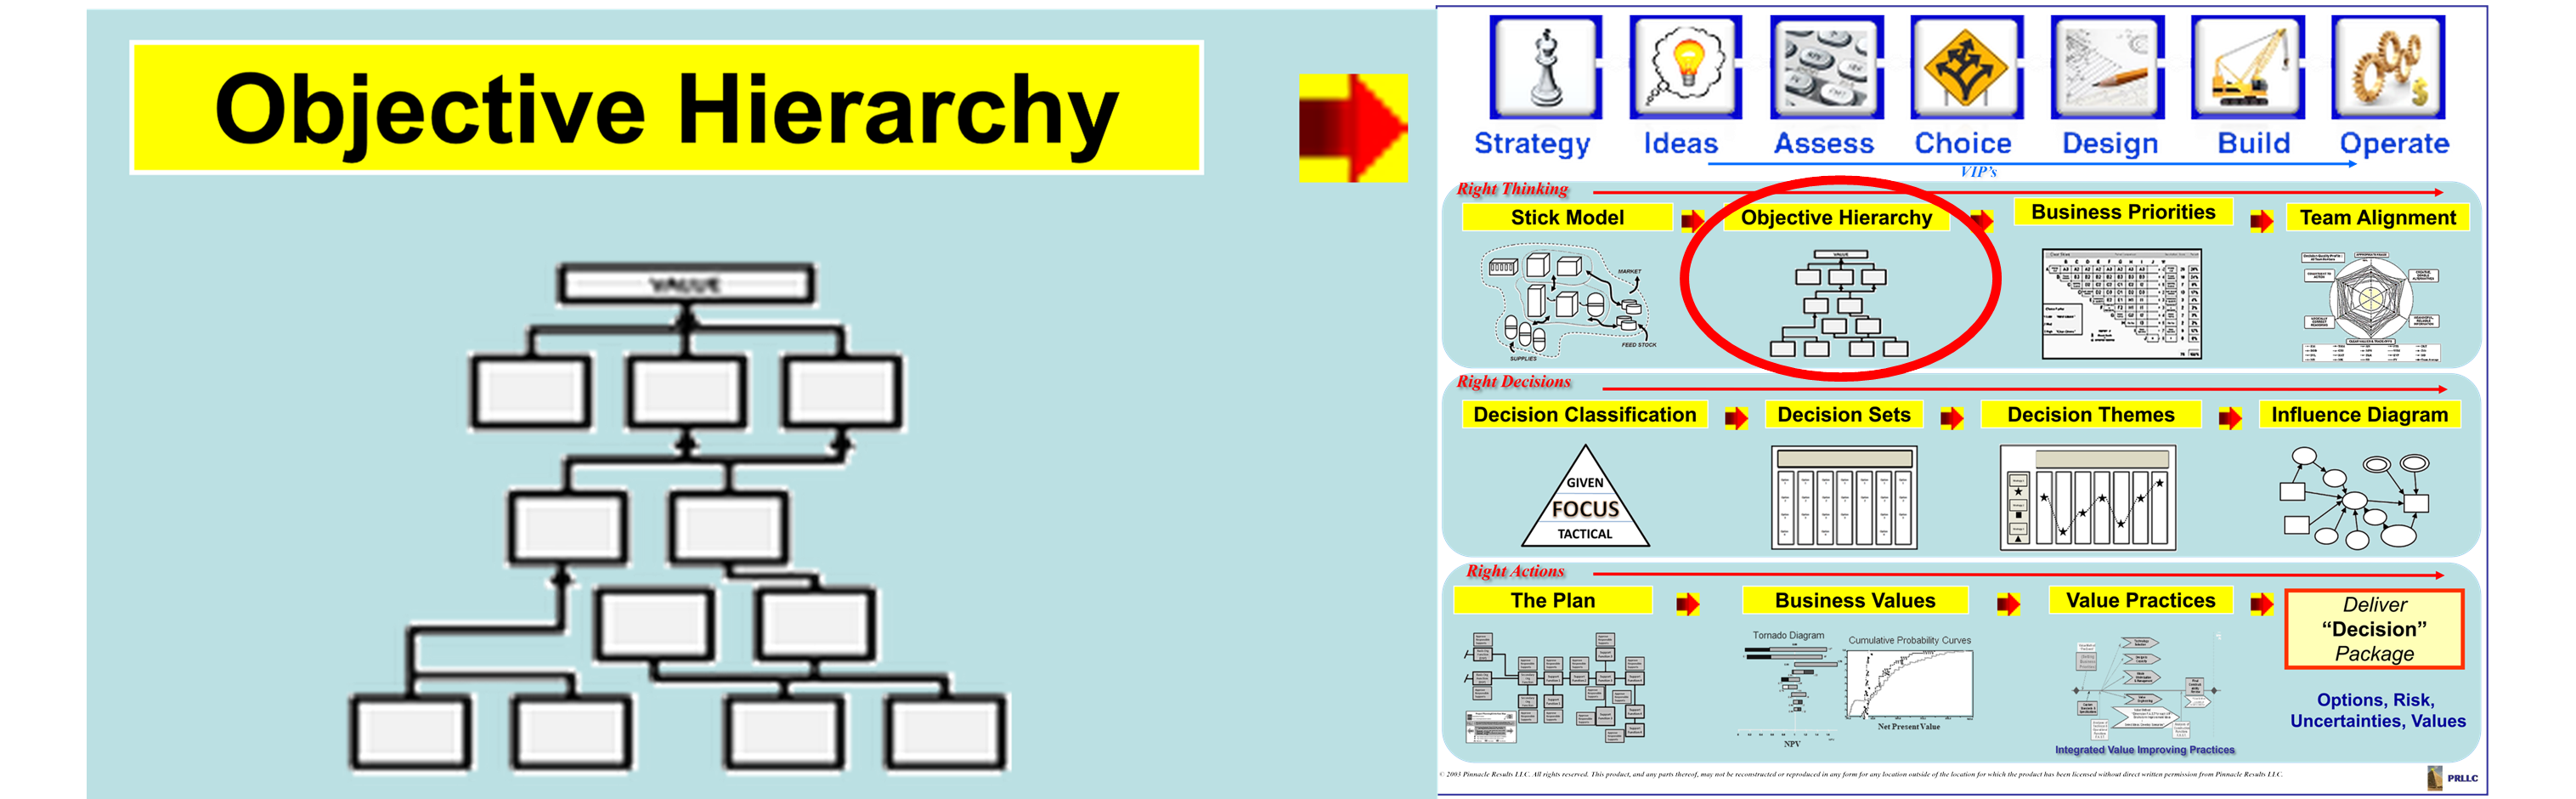
Objectives Hierarchy Tree:
An Objectives-Decisions-Actions Tree systematically bridges strategic corporate value and tactical project execution by breaking down shareholder value into actionable means objectives. The framework explicitly maps these drivers to critical project decisions and the precise operational actions required to make them successfully. This tool delivers a simplified, requisite model that defines clear decision criteria and establishes alignment across the organization. It expands Keeney's foundational objectives hierarchy into execution, a refinement developed by McCuish and Jennings.
Setting Business Project Priorities:
A vital stakeholder calibration exercise where project sponsors and asset teams explicitly force-rank competing execution metrics. It determines the ordered precedence of such values as Time-to-Market, Upfront CapEx Reduction, Social and Sustainability impact, or Long-Term Operational Efficiency. This stops engineering teams from wasting hours trying to optimize conflicting variables simultaneously.
Decision Radar:
A diagnostic maturity visual that graphs the project's current state of clarity, alignment, and technical readiness across core decision-quality elements. It instantly highlights which technical, regulatory, or financial areas are blind spots requiring immediate resource allocation before moving past early stage-gates.
"Right Decisions" (Structuring Options & Alternative Analysis)
Once the foundational truths, boundaries, and priorities are established, the middle line provides the formal analytical engine to structure choices. It replaces emotionally driven or unvetted technical preferences with rigorous alternative analysis, ensuring absolute decision quality.
Decision Hierarchy (Decision Classification):
A governance tool that categorizes upcoming project choices into three distinct buckets: Given (fixed policy decisions already finalized by senior management), Focus (strategic decisions the immediate project team must analyze and solve right now), and Tactical (lower-level construction choices that can safely wait). This prevents the asset team from wasting valuable engineering hours debating fixed corporate mandates or premature execution details.
Decision Table:
A comprehensive Decision matrix that maps out every major decision area across the top row, with all creative, doable, and mutually exclusive options ... which are compelling to analyses ... listed in the columns below them. It lays bare the entire landscape of standalone technical and commercial choices available to the project team.
Strategy Table:
The framework used to mix, match, and link individual options from the Decision Table into distinct, holistic project paths based on explicit "Strategy Themes" (such as a "Minimum CapEx Path" versus a "Maximum Lifecycle Asset Path"). By "threading" these options together, the team tests decisions as a fully synchronized system rather than isolated choices.
Influence Diagram (The Risk Model Engine):
A systems-thinking map that visually connects technical choices directly to real-world uncertainties, variables, and financial metrics. This visual diagram directly builds the mathematical backend of the probabilistic risk model. It maps dependencies using standardized nodes, allowing the team to feed data into software to generate predictive tornado diagrams and cumulative probability curves.
"Right Actions" (Developing the Auditable Blueprint)
The bottom line takes the optimal strategy mathematically proven in the middle line and turns it into a highly optimized, auditable execution blueprint. This is the final verification, scheduling, and risk-mitigation stage completed before full funding is released.
The Plan (Organization Function Diagram / FAST Model):
A highly visible, logical map that breaks down the project scope into the exact organizational functions and interdependencies required to deliver the asset. By evaluating what the organization must achieve before designing a regimented schedule, it allows leaders to assign precise roles, accountabilities, and cross-functional interfaces across all engineering and design work fronts. Populates P6 etc. and establishes a logic based input to a resource loaded project schedule.
Results Projected:
The output generated by turning the Organization Function Map into a resource-loaded project schedule (such as in Primavera 6 or MS Project) backed by comprehensive cash-flow and multi-year economic modeling. It projects the exact capital expenditure (CapEx), operating expenses (OpEx), Net Present Value (NPV), and Internal Rate of Return (IRR%) of the selected execution pathway.
Value Improving Practices (VIPs):
Standardized, industry-proven optimization exercises (such as formal Process Simplification, Technology Selection, Design to Capacity,Value Engineering, Design for Constructability Reviews, and Waste Minimization) forced onto the selected design. This systematically squeezes out capital inefficiencies and improves overall Return on Investment without degrading the safety, reliability, or ultimate functionality of the asset.
Decision Support Package (DSP):
The ultimate, comprehensive deliverable of the BlueSheet methodology. This is the definitive, auditable governance volume of the BlueSheet methodology presented to capital allocation committees. Rather than a mere proof of past work, the DSP provides absolute clarity and the full requisite support for executives to confidently authorize continued project funding. Synthesizing project overviews, robust business cases, probabilistic risk analyses, and forward execution plans, it delivers undeniable proof of rigorous alternative testing and interface mapping, giving gatekeepers the data-backed assurance to allocate capital.